AI-assisted research, methods, software and teaching
Peter Sørensen
Center for Quantitative Genetics and Genomics, Aarhus University
What is AI?
Artificial intelligence
The broad field of building systems that perform tasks associated with human intelligence
Machine learning and deep learning
Methods that learn patterns from data. Deep learning uses neural networks with many layers
Generative AI
Models that generate text, code, images, audio or other content
AI assistants and agents
Systems built around generative AI that can work with users, files and tools. Agents can carry out multistep tasks
This presentation focuses on AI assistants and agents used for data analysis, method and software development, and teaching.
People use the term AI in different ways. Some think of machine learning or deep neural networks used to analyse data. Others think primarily of generative tools such as ChatGPT.
Machine learning covers methods that learn patterns from data. Deep learning is a form of machine learning based on neural networks with many layers. Modern generative AI is largely based on deep learning, but its purpose is to generate new content rather than only produce predictions.
Assistants interact with users and may have access to files and tools. Agents can use these capabilities to carry out more complex, multistep tasks.
This presentation concerns practical AI-assisted work. Applying machine learning as the scientific method being studied is outside its scope.
How researchers use generative AI
Writing and communication
Draft, revise, translate and shorten text
Literature work
Find relevant papers, summarise them and compare their conclusions
Data analysis
Inspect data, write code, make figures and explain results
Teaching
Develop slides, exercises, examples and explanations
Administration
Prepare emails, meeting notes, plans and reports
Writing and literature review are common entry points. The same technology can also contribute directly to mathematical, analytical and software work.
Many researchers first encounter generative AI as a writing assistant. It can also help identify literature, organise information, write analysis code and develop teaching material.
These uses still require review. Literature searches must be checked against the original sources, and scientific claims must not be accepted simply because the generated text sounds convincing.
The following slides focus on applications in method and software development.
Areas of AI-assisted work
Data analysis
An analysis script and report
A reproducible analysis workflow
Method development
A statistical model or algorithm
A clearly defined method with validation evidence
Software development
R and C++ code, interfaces and documentation
Tested and maintainable software components
Teaching
Slides, simulations and worked examples
Editable teaching materials
AI can help with mathematical reasoning, coding, analysis and documentation. Researchers set the scientific direction, review the decisions and determine what evidence is sufficient.
These activities are connected but distinct. A data-analysis question may reveal the need for a new statistical method. The method must then be translated into reliable software before it can be used routinely. A validated implementation can support new analyses and become a teaching example.
AI is particularly useful at the connection between mathematics and software. It can help examine equations, compare algorithms, implement them in R or C++, and prepare numerical checks. Researchers define the scientific problem, review the statistical and computational decisions, and decide what evidence is required.
From numerical algorithms to an analysis package
Numerical computation Sparse solves and the inverse entries needed for model calculations
Native C++ and shared libraries Solver interfaces, reuse of calculations and diagnostics
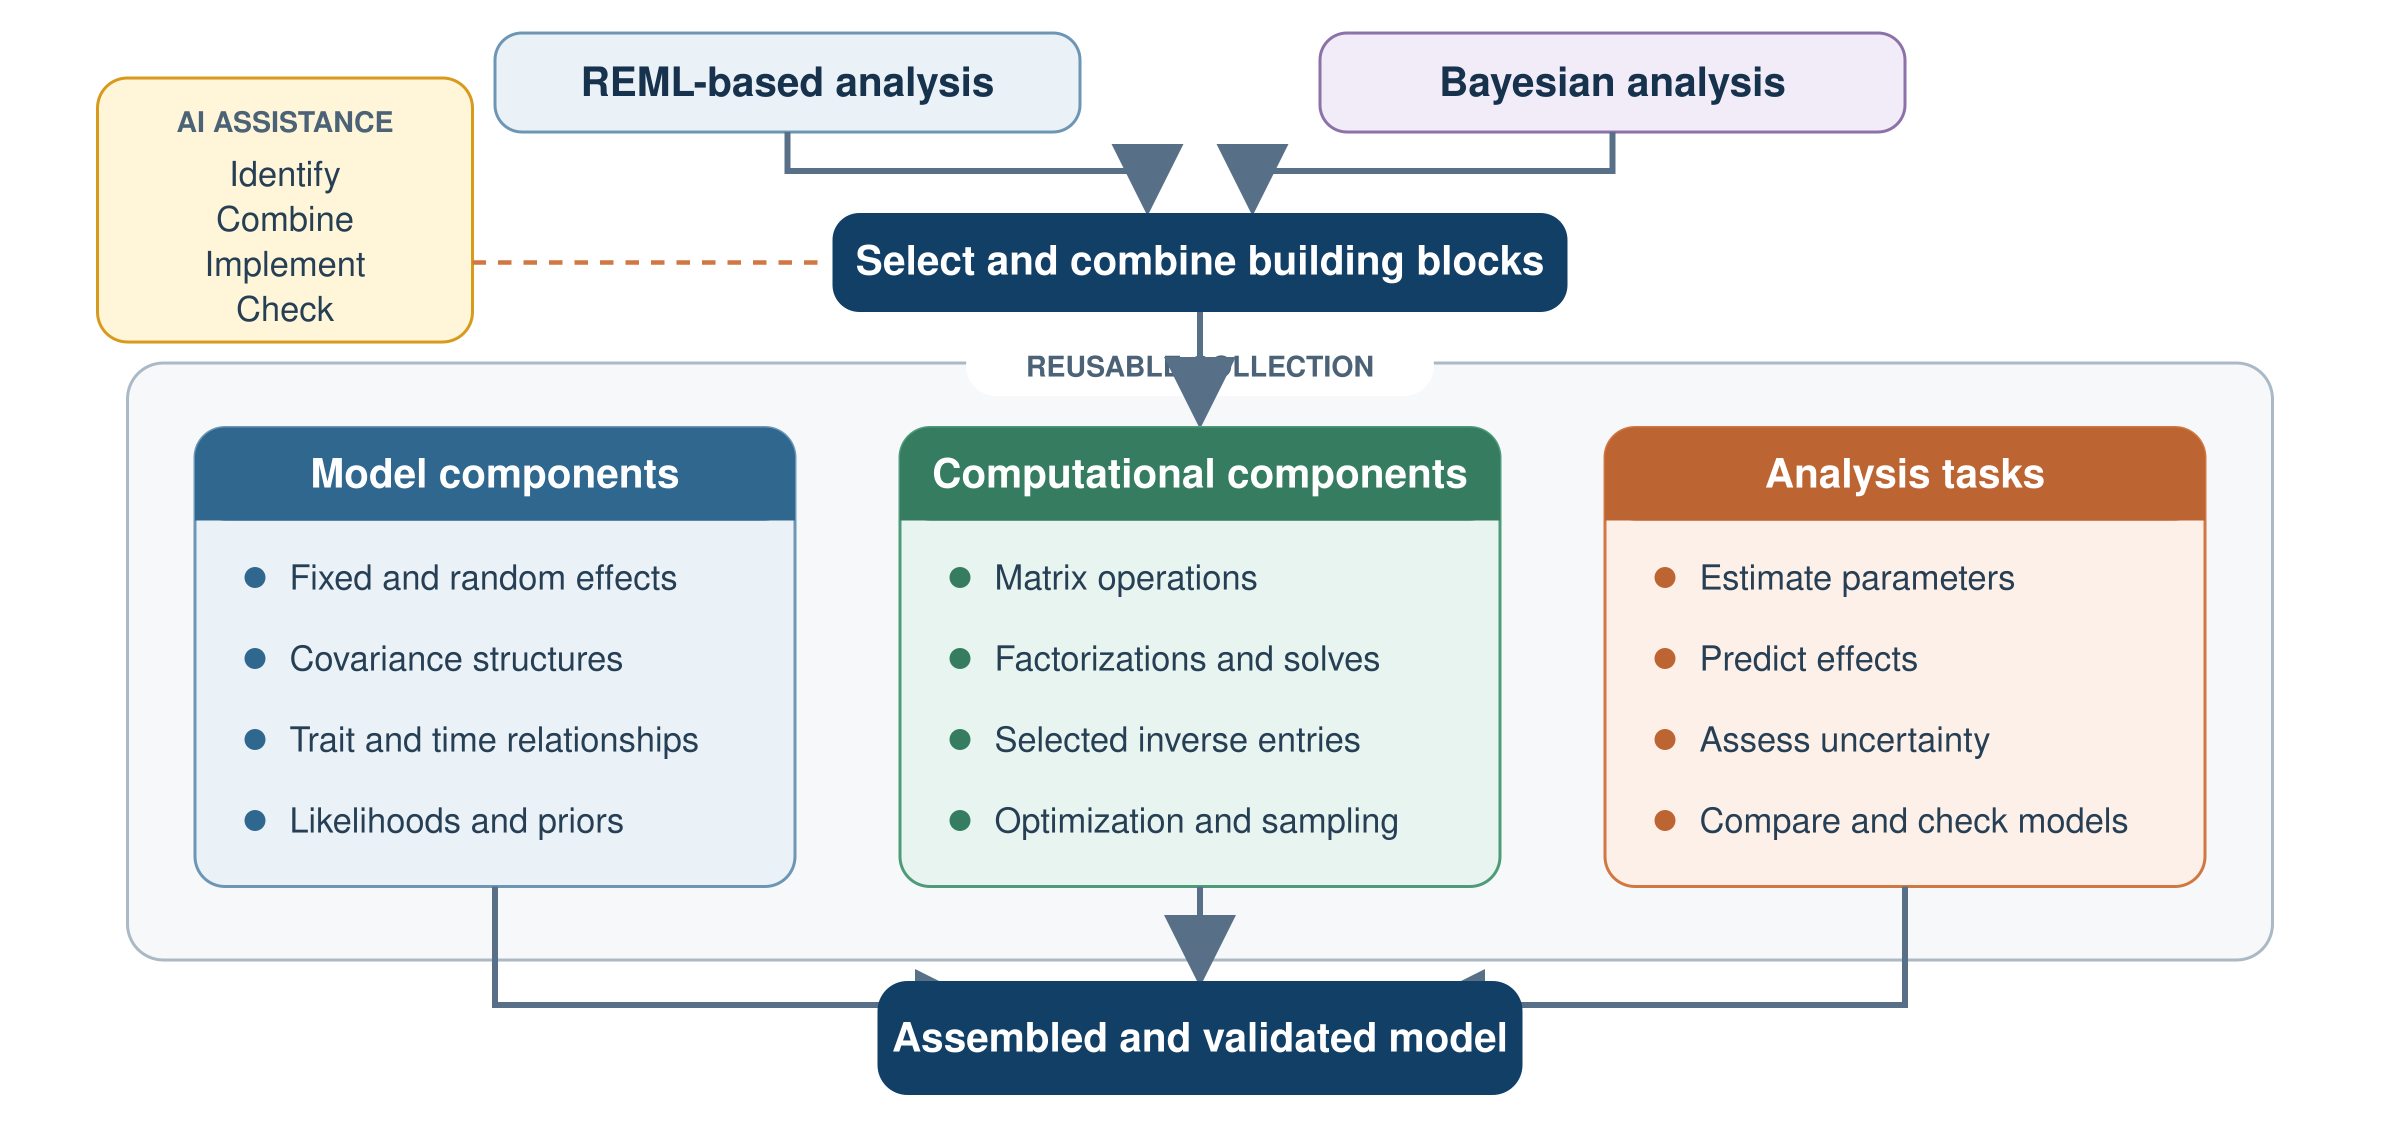
Reusable model components Covariance models, estimation, prediction and computational tasks
R interface Model specification and results through gfit() and gvc()
The solver infrastructure uses established numerical libraries: CHOLMOD / SuiteSparse and PARDISO .
Read the table from top to bottom, following the development from algorithms to the user interface. gsuite is the R-facing package; the numerical and statistical components live in focused libraries behind it.
CHOLMOD and PARDISO are external libraries. The gsolve selected-inverse implementation uses retained CHOLMOD factors. It computes needed inverse entries without forming the full dense inverse; PARDISO is not used for that selected-inverse route. The work also includes the surrounding solver infrastructure, reuse, model computations and R integration.
A Python interface remains a possible future addition, not a current claim. The technical deck contains the repository map and equations.
Developing gsuite with AI
Mathematics and design
Discuss the model and its assumptions
Derive the required computations
Compare algorithms and special cases
Decide what to implement or reuse
Implementation and review
Work directly with the R and C++ code
Compile and run focused checks
Inspect failures and revise the approach
Retain reviewed code and documentation
AI assistance connects statistical ideas with their implementation.
ChatGPT supported discussion of statistical models, mathematics and software design. Codex supported work directly in the repositories. The assistant can examine the code, make a focused change, build it, run checks and explain the result.
This has made it possible to work through several layers in the same conversation. The developer remains the editor: defining the purpose, questioning assumptions, reviewing decisions and deciding what evidence is sufficient.
A concrete computational example was obtaining selected inverse entries from retained sparse factors. The task connects a mathematical requirement in REML with an algorithm, a native implementation and a reusable solver capability.
Checking the calculations
Small reference calculations Compare the efficient selected inverse with dense and scalar references in C++
Computational behaviour Check factor reuse, thread agreement and retained solves
Independent software comparison Compare matched pedigree models with DMU on 50,000 animals
User workflow Fit models through R and inspect summaries, predictions and diagnostics
In the saved DMU comparison, covariance estimates differed by less than \(4.3\times10^{-8}\) .
Historical comparison: gsuite 0.29.0 and DMU 5.6; three frozen pedigree models. Results and scope
Both the small references and the efficient selected-inverse algorithm are native C++. The references include a dense inverse and a separate scalar Takahashi calculation. Independence comes from the different computational approaches, not from using different programming languages.
The saved DMU evidence covers single-trait, multitrait and longitudinal models. The numerical agreement is concrete evidence for those versions, models and settings. It does not qualify every current capability. The following slide shows historical runtime evidence. Individual desktop timings varied markedly in later reruns.
Checks must continue as the software changes. A recent current-version multitrait rerun reached estimates close to the historical endpoint but failed its line-search requirement. That remains a failure to investigate, not a successful current-version benchmark. Running code and supported models are not the same acceptance state.
gsuite versus DMU: agreement and runtime
Numerical agreement
50,000 animals
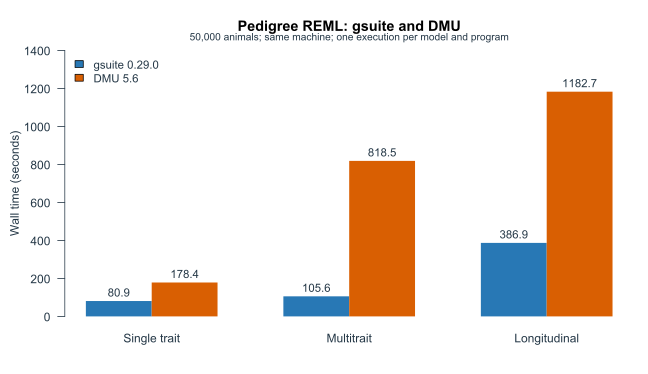
Maximum covariance-estimate difference below \(4.3\times10^{-8}\) .
Prediction correlations essentially 1 on 1,000 preselected animals.
Competitive runtime on these three tested models.
gsuite 0.29.0 and DMU 5.6. Each bar represents one execution. The work boundaries differ: gsuite fitting versus DMU preprocessing and fitting.
The numerical results provide evidence for these frozen direct pedigree REML models. Covariance agreement covers the saved parameters. Prediction correlations exceed 0.999999999998 on the predeclared first 1,000 pedigree-coded animals, not all 50,000. Likelihood constants remain unreconciled. Timings are descriptive single runs with different work boundaries, so this is not a general speed claim or qualification of all current gsuite routes.
A pedigree analysis as a conversation
How much genetic variation is present in body weight, and how accurately can breeding values be predicted?
Work through the analysis
Check pedigree, observations and missing values
Discuss fixed effects and genetic effects
Fit the model and check convergence
Inspect estimates and predictions
Save the R script, figures and report
Keep the model explicit
<- gfit (formula = BW ~ sex + cohort + herd + (1 | id),data = data,pedigree = pedigree,task = "reml" ,control = fit_controlsummary (fit)Ordinary R data frames; a model that can be reviewed and rerun.
This code follows the single-trait pedigree tutorial. The data frames and fit_control are prepared in that tutorial; the slide is an excerpt, not a standalone analysis script. The saved example has 10,000 pedigree animals, with 8,588 animals observed.
The assistant can help inspect identifiers, missingness and covariates, explain the model and run the code. Researchers review which effects belong in the analysis and what the resulting estimates mean. The report should include variance estimates, fit status and diagnostic plots, not just a fitted object.
Simulation truth supports the teaching example. Real data require scientific interpretation and sensitivity checks; a plausible plot does not establish that the model assumptions are correct.
A concrete case: GWAS summary statistics
The question: can existing building blocks support a family of methods for heritability and genetic correlation?
Genome-wide and annotation-based
LDSC, GNOVA, SumHer
Regional
HESS/rho-HESS, SUPERGNOVA, LAVA
Conditional relationships
LAVA regression and partial genetic correlations
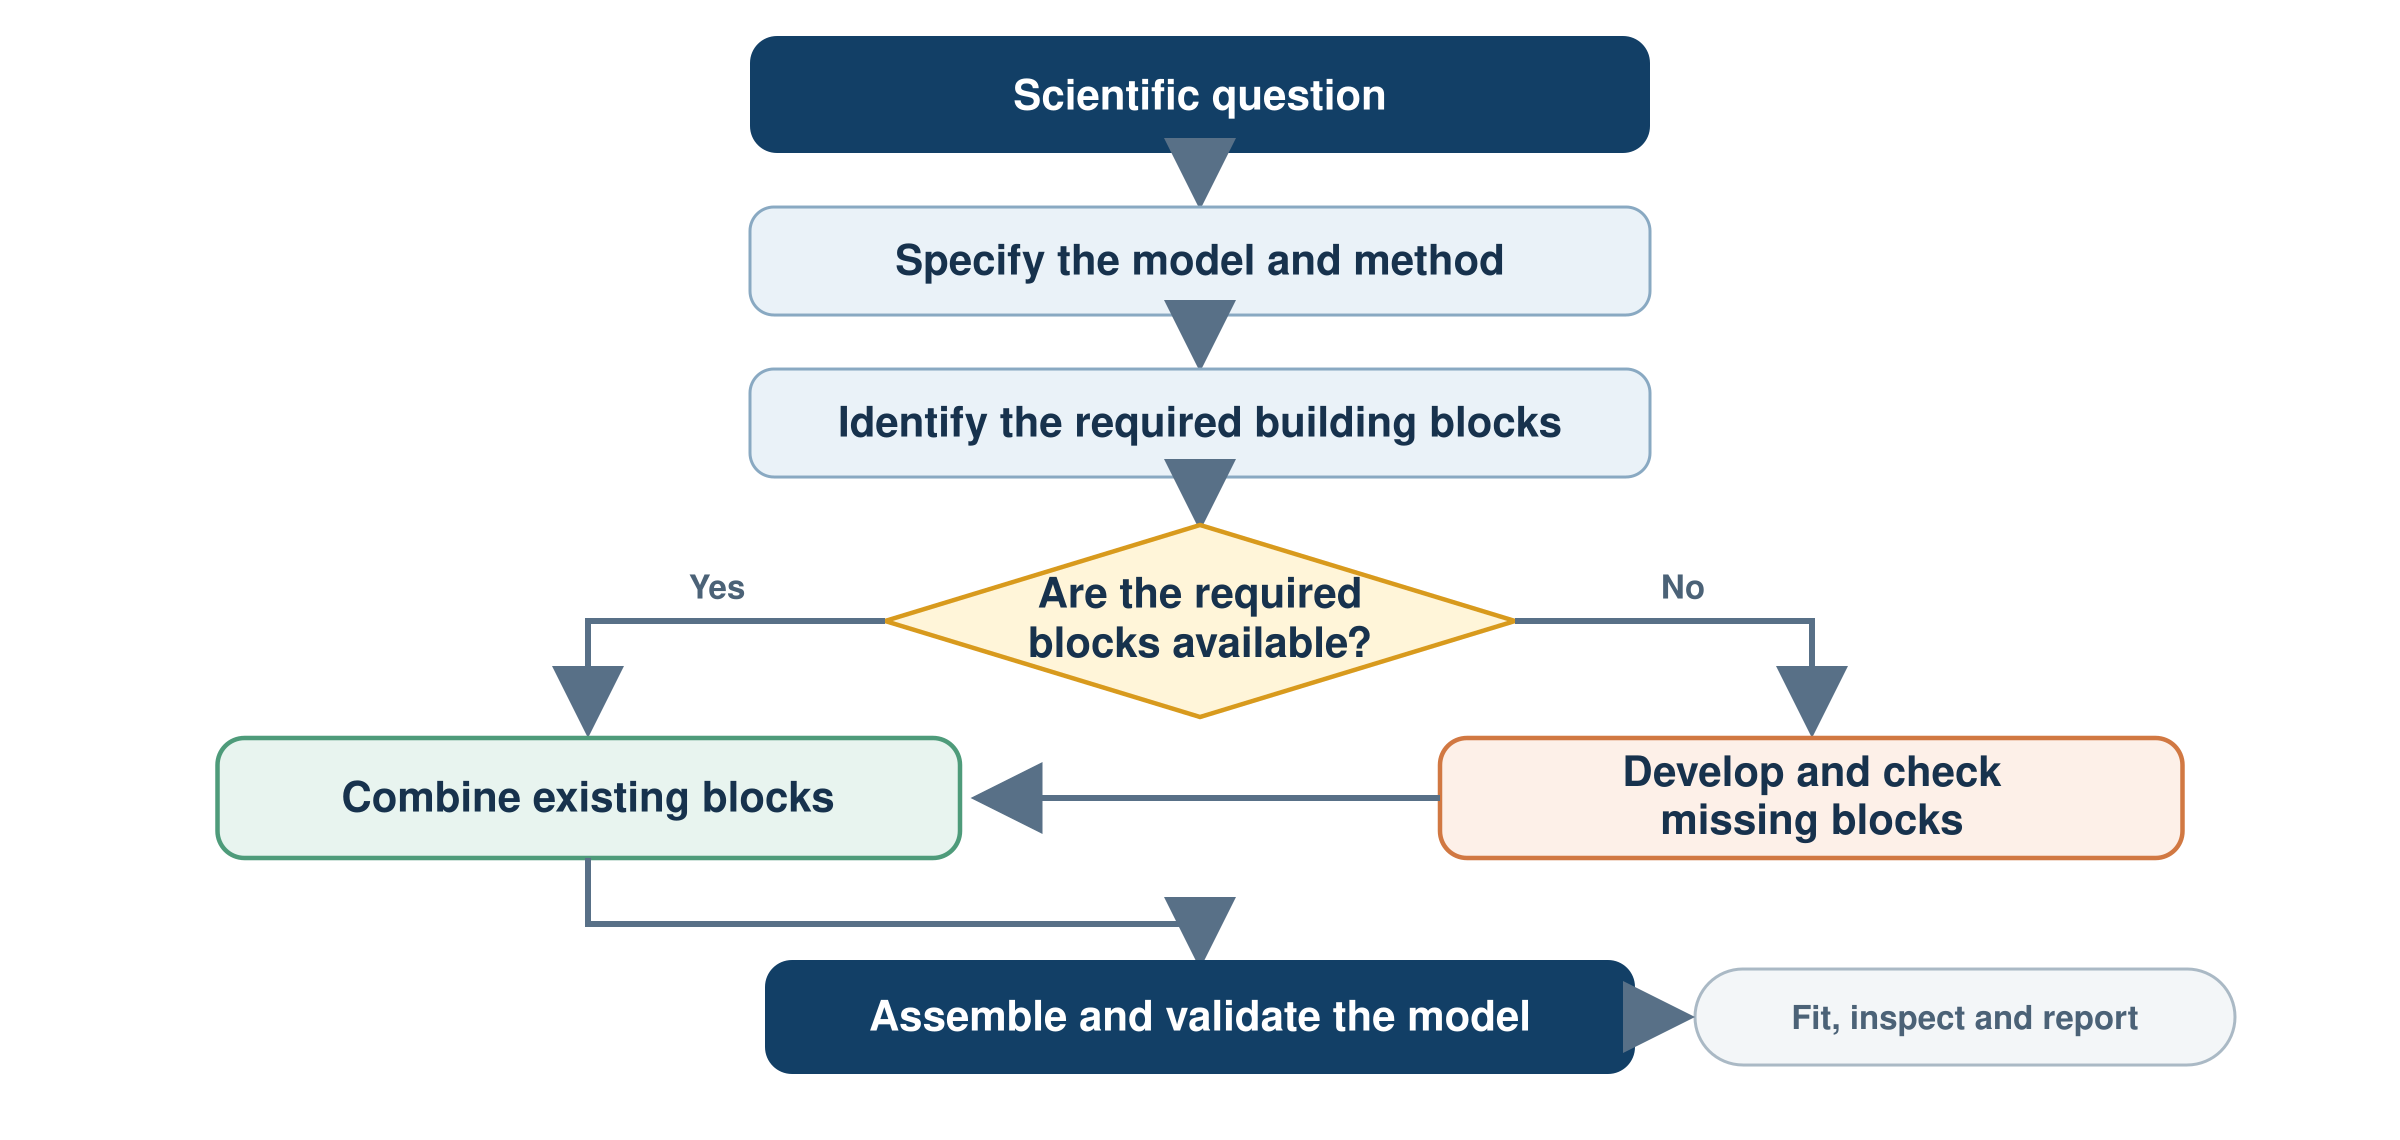
Native calculations in gcorr , reusable LD resources in gmat , numerical components in gsolve , and a common gsuite R interface .
The outcome includes working examples, diagnostics and documented limits.
This is a concrete example of developing methods with an assistant. The starting point was existing software, including an LDSC core and sparse LD machinery. The question above is a summary of the initiating discussion, not a verbatim quote.
These are implementations of established method families, with bounded supported options. They are not claims of complete parity with every original package. The common interface preserves different meanings of annotation components, category totals and regional quantities, and method-specific uncertainty.
How the researcher and assistant worked
Define the next capability
Set the scientific question and scope
Inspect equations and existing components
Implement and check
Review assumptions and challenge results
Write native code; compare small numerical oracles
Connect and evaluate
Decide what is supported and what needs investigation
Add the R interface, examples and simulations
Short, reviewed steps: specify → implement → test → discuss → commit.
The checks included independent calculations, selected upstream comparisons, R/native agreement and simulated data with known truth.
The conversation repeatedly narrowed scope: native libraries first, reuse existing components, keep the interface simple, and do not equate successful execution with statistical validity. The researcher chose the next milestone and reviewed the result before committing. The assistant investigated failures and updated code, tests and documentation.
Evidence was collected as the work progressed. For example, native uncertainty evaluations exposed undercoverage in some settings. Those limits were recorded, not removed by presenting only passing examples. Numerical oracles were small, independent reference calculations, distinct from the production algorithms.
What the development record shows
21 August
Initial native LDSC core already in place
11 September
LDSC extensions and reference comparisons
12–13 September
Additional method families, multivariate extensions and evaluations
14 September
LDlist, R interfaces, aligned results and the simulation tutorial
Latest package tests: 2,264 checks passed.
20 simulated datasets: about 5.4 minutes , including data generation, LD preparation and fitting.
Calendar dates describe recorded development; human hours and time saved were not measured.
The documented expansion spans 11–14 September, but substantial infrastructure and an LDSC implementation predate it. Do not describe the whole ecosystem as having been built from scratch in four days.
Evidence: gcorr commits 96a8b88 (21 August), 066be5e and c8fa52d (11 September), 35618e7/eaba10e/b4e7a14/159a394/7ee5ea6 and further extensions (12 September), 4b8bef5 (13 September), 666c3ae/fdca4f9 (14 September). gsuite commits 063dba6, 667cb1d, 57e0acf, 10df9bc and 2c7ceeb record the R workflow and test follow-up. The curated discussion record is docs/ldsc-development-record.md.
The 2,264 testthat checks passed against the existing isolated installation; the corrected smoke test and remaining standalone tests also passed. This is not a clean new source-tarball qualification: compiler and package notes remain.
The 5.4 minutes is simulation workflow wall time, not development or human time. The presenter considers comparable pre-AI work a task of months. That is a personal assessment, not a measured counterfactual or an established speedup.
How much assistant time did this take?
Saved task records from 11–14 September 2026 :
Native methods, discussion and evaluations
10 h 24 min
LD reference resources, R interfaces and package checks
4 h
Simulation examples, website updates and slides
35 min
Total assistant task time About 15 hours
From method development to a shared R interface and worked examples, using existing computational building blocks.
Reconstructed from 254 saved task intervals, including automated overnight continuation tasks. Gaps between tasks are excluded.
This is elapsed assistant task time, including builds and tests. It does not measure human review time or the time previously spent developing the underlying infrastructure. Background computation outside active tasks is not fully measured.
It also does not establish how long the same work would have taken without AI. Statistical limitations remain documented.
The reconstruction is recorded in docs/ldsc-development-record.md. The estimate ends before the timing discussion and this slide update.
The simulations also reveal differences
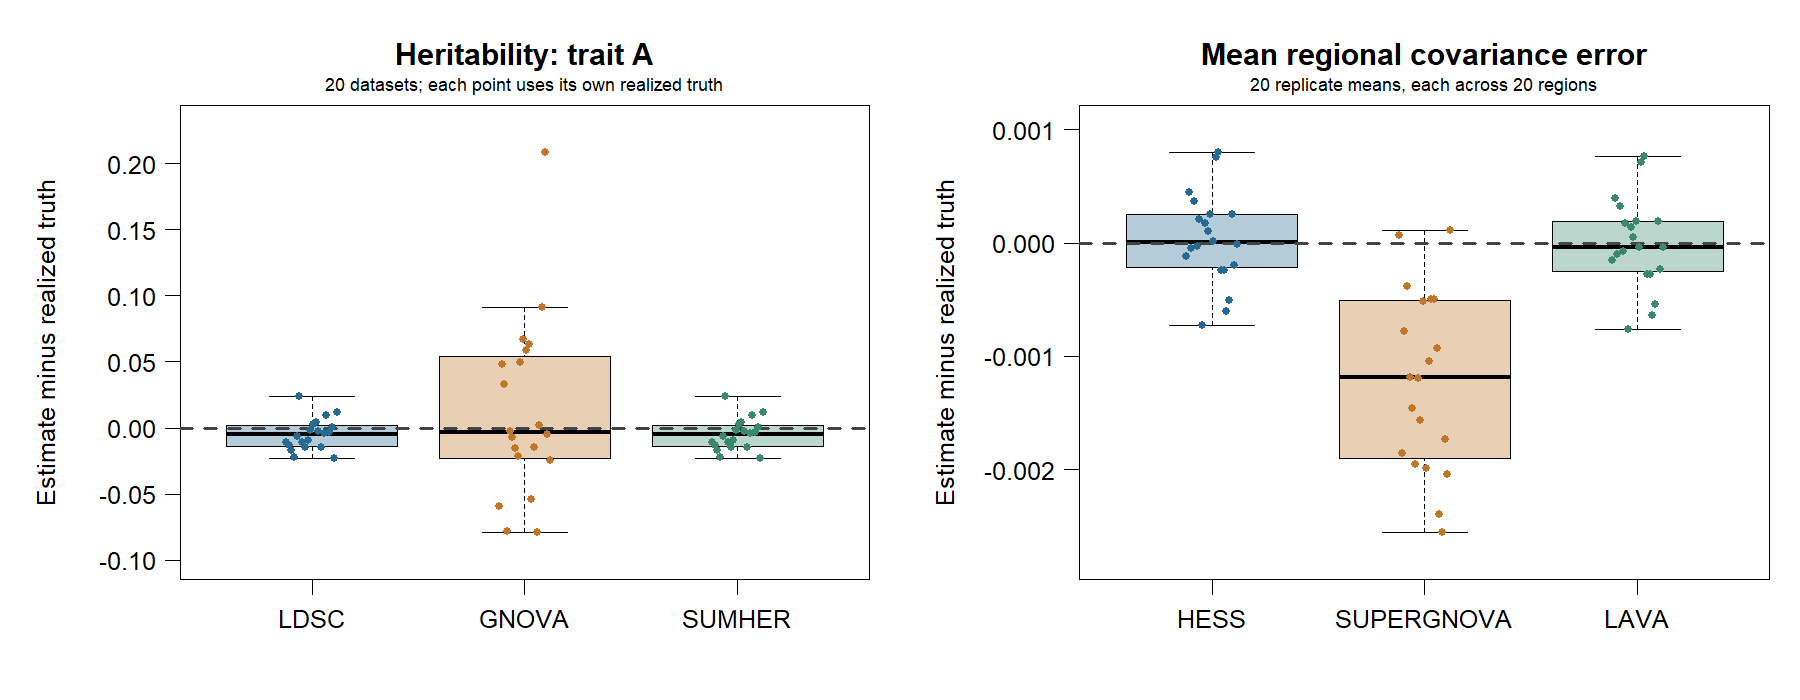
All 1,380 expected point estimates were available. The SUPERGNOVA shift gives a specific result to investigate.
Each dataset has two continuous traits, 10,000 disjoint GWAS individuals per trait, 4,000 independent reference individuals and 20 regions. Each error is relative to its own realized population truth. The left panel shows h2 for trait A. The right panel averages regional covariance errors within each dataset; it does not treat the 400 regions as independent replicates. All points are shown.
Under this design, LDSC and SumHer were almost identical. GNOVA was more variable. HESS and LAVA had small mean regional errors; SUPERGNOVA had mean error -0.001219 and regional RMSE 0.004099, compared with about 0.002 for HESS/LAVA. The cause is not established by this small comparison. Component selection, finite reference LD and assumptions deserve focused investigation. Earlier native records also examined SUPERGNOVA selection sensitivity; this is a new connected workflow observation, not the first discovery of a possible limitation.
One HESS regional SE was unavailable because its estimated matrices failed the uncertainty requirements. LAVA covariance SEs were unavailable for this call. Twenty datasets do not establish general calibration or rank the methods.
What could become a research contribution?
Reusable infrastructure, implemented
Shared LD resources, named covariance results and common numerical components
Native extension, implemented
Annotation-specific genetic regression and partial correlations from GNOVA covariance estimates
Research question to evaluate
Do conditional genetic relationships differ between annotations?
Existing methods can become building blocks for new questions.
Statistical novelty still needs a literature comparison and evidence. Shared code alone is not a new statistical method.
The native annotation extension is documented in gcorr/docs/annotation-multivariate.md and its reliability study. It reuses named genetic covariance matrices for regression and partial correlations, with paired-delete uncertainty. Numerical checks include larger conditioning sets and overlapping categories; statistical validation remains bounded. This extension is not being claimed as exposed by the current gsuite annotation R interface.
Overlapping annotation totals are not independent components and must not be summed. Conditioning describes genetic association, not a causal effect. Weak components, nearly singular predictor covariance and uncertainty calibration remain substantive issues. Any publishable novelty must be distinguished from existing methods and evaluated, rather than inferred from a common interface.
The demonstrated contribution is a reusable implementation and evaluation framework, developed through scientific direction and assistant-supported work.
Where is AI taking research?
What is likely to change
Writing, coding and analysis will become faster
More groups will develop advanced methods and software
AI assistants will perform increasingly complex tasks
Research roles and expectations will change
Questions for the programme
Which expertise and resources will distinguish the programme?
How can AI be combined with the available data and infrastructure?
Which capabilities should be developed and shared?
How should training, review and responsibility change?
What needs to change now for the programme to remain scientifically distinctive as AI becomes part of research?
AI is already part of research, and its capabilities will continue to develop. Routine use of writing assistants or code generation will become common. The strategic question concerns how this changes research and what will remain distinctive.
Scientific questions, domain knowledge, trusted data, critical evaluation and responsibility will remain important. Shared platforms provide one possible advantage because they capture expertise in infrastructure that researchers and AI assistants can use and extend.
Discussion can focus on the capabilities required, changing research roles, and investments that support scientific strength.
The gsuite experience suggests connecting applied research and development through manageable scientific questions. Each project can leave reusable analyses, checked components and documented evidence for later work. Scientific quality, review effort and maintenance matter alongside time saved.