50K pedigree REML qualification against DMU
This benchmark compares gsuite 0.29.0 with DMU 5.6 on one frozen 50,000-animal pedigree using single-trait, multitrait, and rank-2 longitudinal animal models. It is a practical cross-software qualification, not a repeated performance benchmark or an exact simulation oracle.
The public gsim 0.2.0 generators are used unchanged. Their latent effects are not exact inbreeding-aware draws from the fitted relationship model, exact_relationship_draw is false, multitrait missingness follows gsim’s native observation patterns, and the realized phenotyped count is 42,497. Truth comparisons are therefore descriptive. The primary evidence is agreement between gsuite and DMU on the same frozen observations and pedigree.
Results
Back to all benchmarks · Public scope
The saved results below compare gsuite 0.29.0 and DMU 5.6. Both used direct pedigree REML on identical frozen data and starts. gsuite used CHOLMOD selected inversion; DMU used dmu1 followed by direct dmuai. Across the three models, the largest absolute covariance-estimate difference is below \(4.3\times10^{-8}\).
Prediction metrics use the predeclared first 1,000 pedigree-coded animals (856 phenotyped and 144 unphenotyped), not all 50,000 animals. The tables show Pearson correlation and normalized RMSE for each effect on that subset.
Timings are single executions on the same Intel Core i7-1365U Windows machine. gsuite times cover the fit; DMU times cover the dmu1 plus dmuai pipeline. They include different work boundaries and do not establish general speedups. See the selected hardware, software and thread settings and the convergence table below. The original development PDF is not part of this public snapshot.
Single-trait results
| Covariance parameter | gsuite | DMU |
|---|---|---|
| G[1,1] | 0.9912148142 | 0.9912148200 |
| R[1,1] | 1.1348505615 | 1.1348506000 |
\(G\) denotes the genetic covariance matrix; \(R\) denotes the residual covariance matrix.
| Prediction effect | Animals | Pearson correlation | Normalized RMSE |
|---|---|---|---|
| animal | 1000 | 0.999999999998527 | 1.721e-06 |
| Program | Observed wall time (seconds) |
|---|---|
| gsuite fit | 80.920 |
| DMU pipeline | 178.421 |
Multitrait results
| Covariance parameter | gsuite | DMU |
|---|---|---|
| G[1,1] | 1.0513593430 | 1.0513593000 |
| G[2,1] | 0.4060368505 | 0.4060368500 |
| G[2,2] | 0.8012559231 | 0.8012559300 |
| R[1,1] | 1.0986902326 | 1.0986902000 |
| R[2,1] | 0.2413718588 | 0.2413718600 |
| R[2,2] | 0.8975498573 | 0.8975498500 |
\(G\) denotes the genetic covariance matrix; \(R\) denotes the residual covariance matrix.
| Prediction effect | Animals | Pearson correlation | Normalized RMSE |
|---|---|---|---|
| trait1 | 1000 | 0.999999999998714 | 1.604e-06 |
| trait2 | 1000 | 0.999999999998806 | 1.552e-06 |
| Program | Observed wall time (seconds) |
|---|---|
| gsuite fit | 105.640 |
| DMU pipeline | 818.460 |
Longitudinal results
| Covariance parameter | gsuite | DMU |
|---|---|---|
| Q[1,1] | 1.0057441325 | 1.0057441000 |
| Q[2,1] | 0.1463268382 | 0.1463268400 |
| Q[2,2] | 0.2475494863 | 0.2475494800 |
| R[1,1] | 0.7974774374 | 0.7974774400 |
\(Q\) denotes the genetic random-regression coefficient covariance matrix; \(R\) denotes the residual covariance matrix.
| Prediction effect | Animals | Pearson correlation | Normalized RMSE |
|---|---|---|---|
| coefficient1 | 1000 | 0.999999999998514 | 1.734e-06 |
| coefficient2 | 1000 | 0.999999999999474 | 1.081e-06 |
| Program | Observed wall time (seconds) |
|---|---|
| gsuite fit | 386.860 |
| DMU pipeline | 1182.680 |
Saved evidence
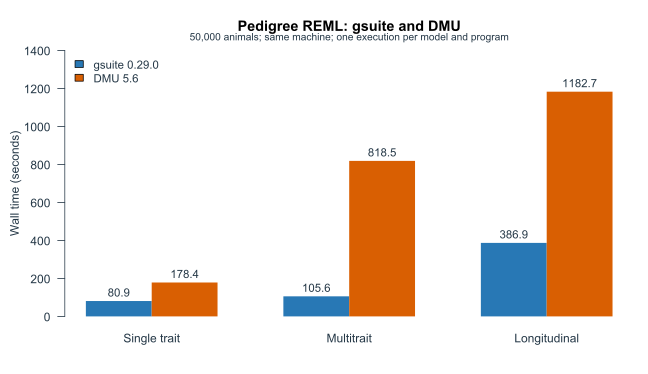
The website figure is drawn from the saved timing CSV.
- Covariance estimates (CSV)
- Prediction metrics, including observation subsets (CSV)
- Timing stages (CSV)
- Convergence diagnostics (CSV)
- Frozen study dimensions (CSV)
These tables summarize the committed evidence. No model fitting or new raw-output reparse is performed when rendering this page. Likelihood values are not compared because the DMU additive constant remains unreconciled.