gmap software validation
These recorded simulation results assess selected behavior on ten fixed datasets from the shared design. They do not revalidate the statistical method or cover every setting. The use snippets show the current package interfaces. This report step summarizes retained artifacts and does not rerun analyses. The gmap guide describes current inputs and options.
Use
mapping_stat <- gmap::gmap_stat(stat, Glist,
                          phenotype_variance = phenotype_variance)
fit <- gmap::gmap(mapping_stat[c("A", "B")], Glist,
            regions = regions, method = "multi_effect",
            prior = prior, control = control)
shared <- gmap::gmap_coloc(
  stat$A, stat$B, region = names(regions)[1],
  phenotype_sd1 = sqrt(phenotype_variance[["A"]]),
  phenotype_sd2 = sqrt(phenotype_variance[["B"]]))
Results
| Check | Ten-replicate result |
|---|---|
| Component sets containing the causal marker | 40/40 |
| Regional fits converged | 40/40 |
| Mean H4 in shared-signal region | 1.000 |
| Mean H3 in distinct-signal region | 1.000 |
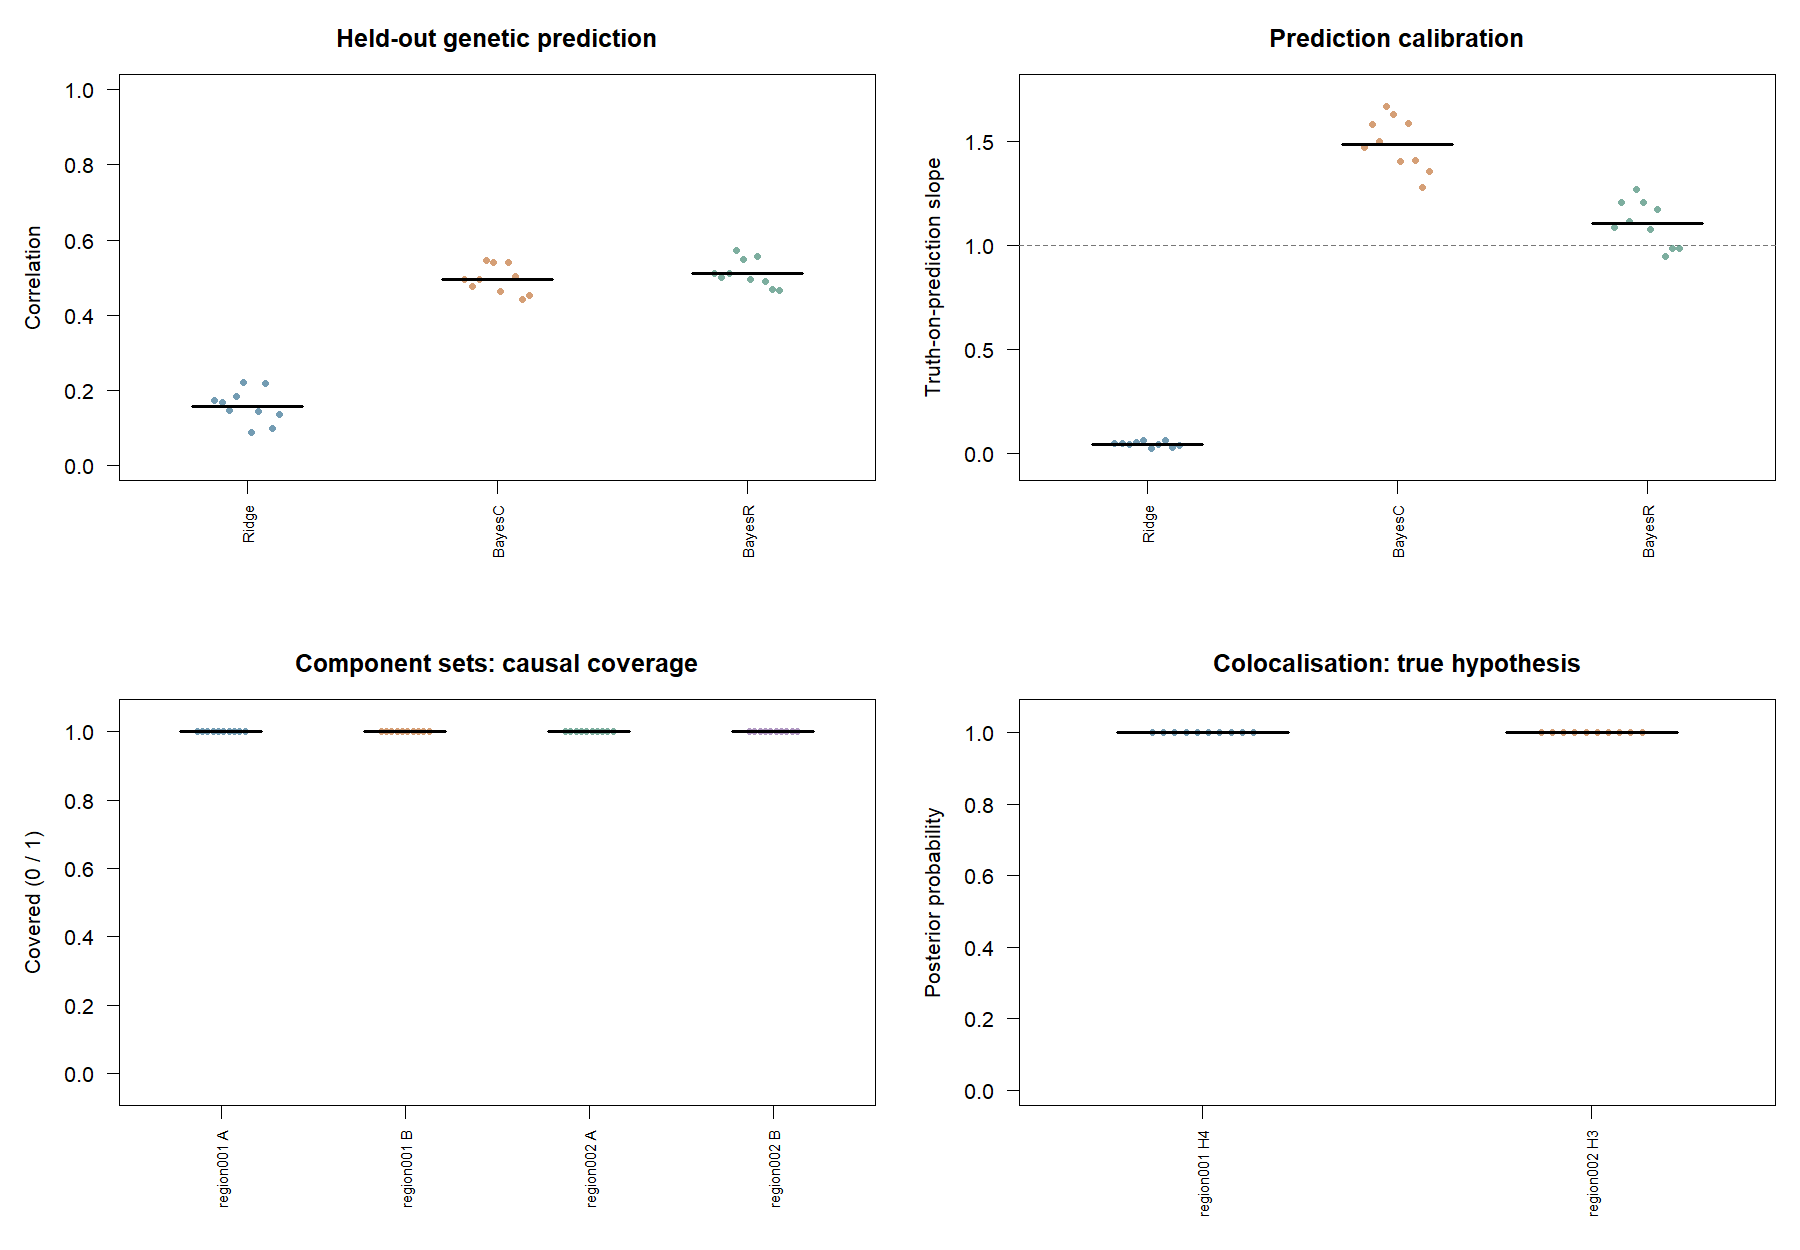
The first two regions were constructed for these hypotheses and contain one causal variant per trait. This is a focused regional check, not broad credible-set coverage or colocalisation calibration across realistic loci.