Heritability and genetic correlation with gcorr
gcorr works with aligned summary statistics. The convenient ldsc() route uses LD scores and reference metadata already held by a gbase Glist. Other public functions provide GNOVA, SumHer, regional covariance methods, covariance models and Mendelian randomisation when their additional inputs are available. This page uses the three disjoint GWAS cohorts from the shared simulation. Run the overview’s loading block first for statistics, reference_Glist and regions.
Estimate genome-wide quantities
statistics is a named list of aligned A, B and C tables from glma. The traits use the same reference markers in the same order. The disjoint GWAS cohorts justify a zero cross-trait overlap intercept in this simulated example; that assumption must be reconsidered for overlapping cohorts.
library(gcorr)

ordinary <- ldsc(statistics, reference_Glist,
  what = "rg", block_count = 200L,
  overlap_intercept = 0,
  marginal_intercept = "fixed_one")

ordinary$estimates
ordinary$h2
ordinary$rg
The h2 rows estimate SNP heritability; rg rows estimate the correlation between genetic effects for trait pairs. The reported standard errors use contiguous delete-block jackknife calculations.
| Quantity | Trait1 | Trait2 | Estimate | Standard error | P value |
|---|---|---|---|---|---|
| h2 | A | 0.267 | 0.0551 | 1.291e-06 | |
| h2 | B | 0.303 | 0.0646 | 2.660e-06 | |
| h2 | C | 0.246 | 0.0667 | 2.223e-04 | |
| rg | A | B | 0.669 | 0.142 | 2.331e-06 |
| rg | A | C | 0.613 | 0.155 | 7.285e-05 |
| rg | B | C | 0.749 | 0.138 | 6.110e-08 |
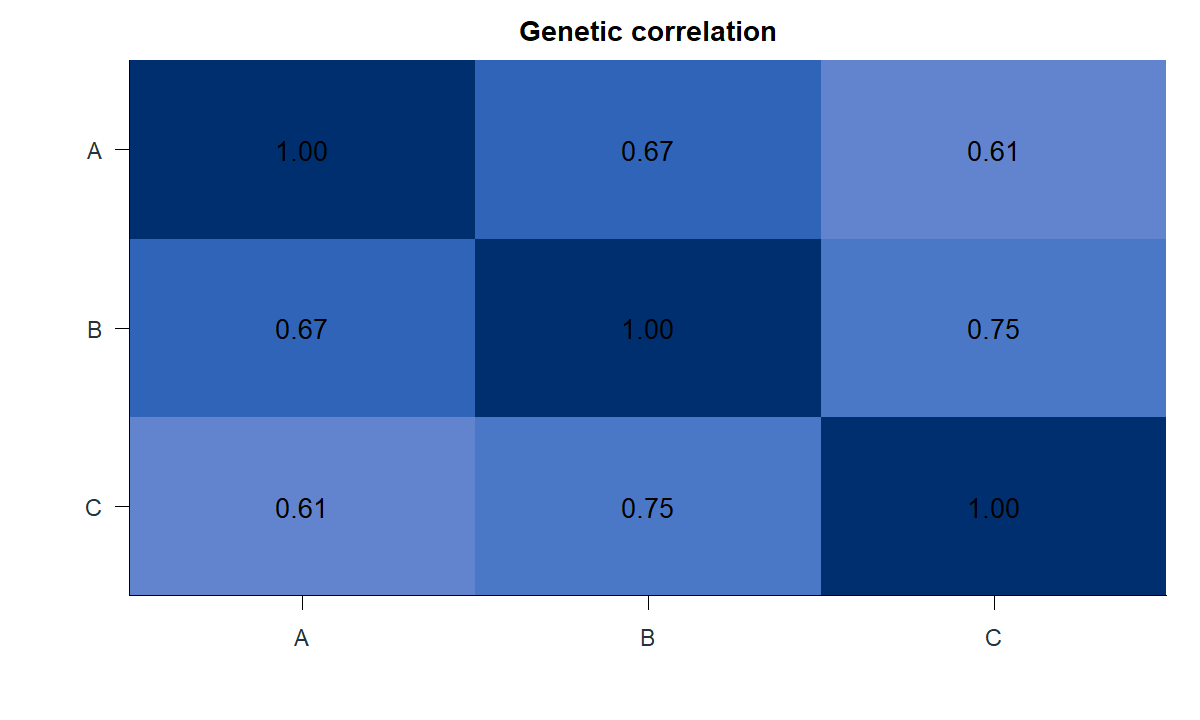
In this one run, the estimated genetic correlations lie between about 0.61 and 0.75. A correlation describes shared genetic effects on the model’s scale; it does not establish a causal relationship between traits. The uncertainty procedure has focused validation limits, so inspect diagnostics and avoid presenting these intervals as fully calibrated for every study.
Attribute heritability to a marker group
The first 80 artificial regions form an enriched annotation. Standard stratified LDSC computes an annotation LD-score column; at any marker it includes LD to annotated markers, including LD that crosses the annotation boundary. The residual column covers the remaining marker membership.
enriched_markers <- unlist(regions[1:80], use.names = FALSE)

partitioned <- ldsc(statistics, reference_Glist,
  sets = list(enriched = enriched_markers),
  residual = TRUE, set_model = "stratified",
  what = "rg", block_count = 200L,
  overlap_intercept = 0,
  marginal_intercept = "fixed_one")

subset(partitioned$estimates,
  trait1 == "A" & is.na(trait2) &
    quantity %in% c("h2", "enrichment"))
The trait A rows from this fit show a total h2 of about 0.36, with about 0.267 attributed to the enriched category. enrichment compares a category’s heritability share with its marker share. It is a model-based estimate, not a count of causal variants.
| Component | Quantity | Estimate | Standard error | P value |
|---|---|---|---|---|
| all | h2 | 0.36 | 0.0695 | 2.139e-07 |
| enriched | h2 | 0.267 | 0.06 | 8.372e-06 |
| enriched | enrichment | 4.63 | 0.541 | 1.074e-17 |
| Residual | h2 | 0.0933 | 0.0351 | 0.00791 |
| Residual | enrichment | 0.308 | 0.103 | 0.0028 |
set_model = "grouped" is also available. It masks the existing ordinary LD-score vector by group membership and can avoid recomputing annotation scores. It answers a different grouped question because LD crossing group boundaries is not allocated to the same annotation columns:
grouped <- ldsc(statistics, reference_Glist,
  sets = list(enriched = enriched_markers), residual = TRUE,
  set_model = "grouped", what = "rg",
  block_count = 200L, overlap_intercept = 0,
  marginal_intercept = "fixed_one")
The displayed partitioned table belongs to the stratified fit, not the grouped example.
Work at regional or covariance level
One prepared regional LD object can be reused across methods and trait pairs. The preparation loads the requested regions and verifies their complete eigensystems once in the current R session:
prepared_regions <- gcorr_prepare_regions(reference_Glist,
  regions = regions[1:20])

regional_h2 <- gcorr_hess(statistics$A, prepared_regions,
  maximum_components = 0, minimum_eigenvalue = 0)
regional_h2$estimates
This call illustrates HESS; regional results were not part of the displayed LDSC table. Regional methods require method-specific sample overlap, eigenvalue and inference choices.
| Analysis | Public interface | Additional information needed |
|---|---|---|
| Genome-wide architecture | gcorr_gnova(), gcorr_sumher() |
Method-specific LD scores, tagging or annotation quantities. |
| Regional heritability/covariance | gcorr_hess(), gcorr_rho_hess(), gcorr_supergnova(), gcorr_lava(), gcorr_hdll() |
Prepared regional LD and the method’s sampling assumptions. |
| Multitrait covariance models | gcorr_covariance(), gcorr_sem(), gcorr_ggm() |
Labelled covariance and its sampling covariance. |
| Mendelian randomisation | gcorr_prepare_mr(), gcorr_gsmr(), gcorr_mr_ivw() |
Harmonized instruments, signed LD and explicit exposure/outcome assumptions. |
The method guide gives the exact inputs and scope for each family. ordinary$diagnostics and partitioned$diagnostics retain the fit checks and assumptions.
Download genome-wide estimates · download trait A partitioned estimates